
Jira Service Desk natively offers dashboard functionality. Although it satisfies a large number of teams, it imposes certain limits on others. In this article, I present to you a solution that exists to build a more advanced dashboard, but also to complete the data provided by Jira with the additional tools. Your ITSM team will benefit from a very from this visually appealing and fruitful board… This solution can also appeal to other teams and be used in the same way. Only the data will change.
The Jira Dashboard
- A dashboard that is heavy and loads slowly: Indeed, if you want to display this page on a Raspberry Pi, for example, it is not uncommon to encounter performance problems on your browser displaying the dashboard.
- Insufficient default Indicators/Gadgets: Some key indicators are not available natively in Jira. We will see in the following point how to add an over-layer of BI (Business Intelligence) on Jira
- With Jira data… only: Logically, the Jira dashboard only displays data from its database. Nevertheless, in some cases, we would like to complete this dashboard with other tools (e. g. supervision).
Choose your ITSM indicators
Before constructing your dashboard, we will define the list of indicators we want to see displayed. Here is a proposal of the 5 most used ITSM performance indicators:
Uptime: Percentage of time the service is available
MTTR (Mean Time To Repair): Average time to restore the service
FCR (First Call Resolution): Percentage of requests resolved on the first call
SLAs not met: Percentage of tickets not meeting announced service level agreements
NPS (Net Promoter Score): Level of customer satisfaction
The data used to calculate these metrics are almost all from Jira, except for some data provided by :
- A supervision tool (Uptime)
- An incident management tool (OpsGenie)
Others will be calculated from the App eazyBI:
- FCR
- MTTR
- SLAs not met
Finally, we will complete our dashboard with a set of metrics concerning the volume of our Jira and Confluence instances.
Calculate metrics
As seen in the introduction of the article, Jira natively proposes a set of gadgets. But, as soon as we want to set up complementary sums, Jira does not respond well to this problem.
For example, Jira natively proposes the Average Time to Resolve a Request. This average time is calculated between the date of creation of the request and the date of resolution.
If I want to add finesse to this calculation, by wanting the average time between the Taken into account state and the Resolved state, for example, Jira will not be able to help me.
To implement these additional sums, we will take advantage of the excellent App eazyBI. This very powerful BI (Business Intelligence) tool will allow us to easily calculate new metrics and expose them to the REST APIs, usable by third-party tools.
Create the dashboard
At this point we have:
- Defined a list of desired indicators,
- Identified the corresponding data sources (Jira, eazyBI, Nagios, CloudWatch…),
- Implemented the calculation of complementary metrics (JQL in Jira, Reports in eazyBI).
Last but not least is to configure the dashboard. We chose the Smashing (Open Source) solution. Smashing offers a very lightweight web server with a large number of predefined gadgets available.
These gadgets are powered by Ruby scripts that take care of making calls to the various data sources (REST, SQL…).
So we have to configure:
- Ruby scripts making REST calls,
- gadgets for formatting,
- the dashboard for the layout.
A full piece of documentation about this can be read here: https://smashing.github.io/
Results
BOOM!
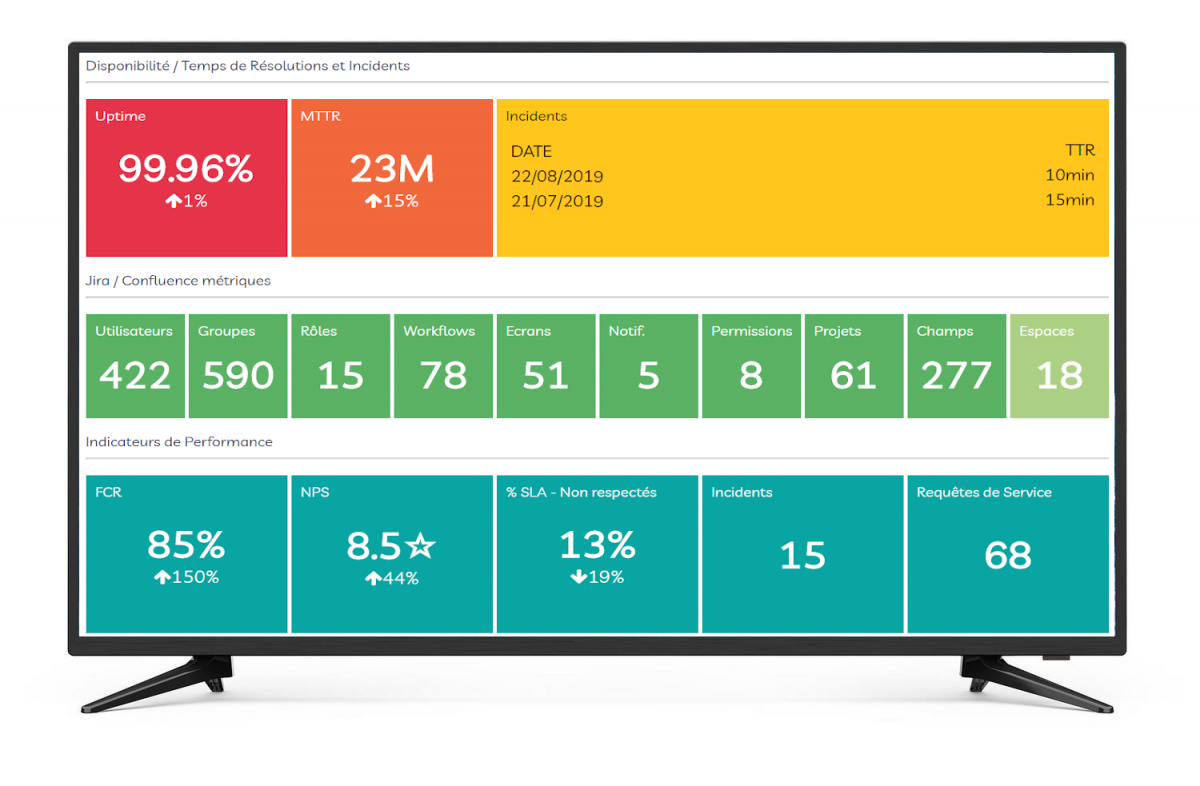
A visual representation of a Jira Wallboard
We can see the different indicators in a visual, minimal and effective dashboard. This table can, of course, be configured according to your graphic charter or be completed with other indicators.
Conclusion
Smashing offers a real alternative to the Jira dashboard, its lightness (runs perfectly on a Raspberry Pi) and its ease of configuration allows it to be deployed in a very short time. Let us go back to the 3 ideas set out in the introduction to the article:
- It runs perfectly on a Raspberry PI. The load time is almost instantaneous and each Widget has its cooling frequency.
- By exploiting the REST APIs of the different tools in your ecosystem and the ease of configuration of the Gadgets, your list of indicators is unlimited… Or almost! The only condition is that the data exists of course.
- Nagios, Jira Service Desk, OpsGenie, and eazyBI… Here is the (small) list of tools used today in this article. Once again, the possibilities are endless. You can be as creative as possible!
The most complicated thing is finally to define the ITSM indicators that will really move your team forward. Valiantys can assist you in this field, as well as in the implementation of your dashboards of course. To go further, feel free to contact us, browse our other ITSM blogs or our ITSM Practice page.
Contact us for more ITSM information