
This is a guest post by Lucidchart, which was created in 2008 to offer collaborative online diagramming solutions. Today, Lucidchart and its sister product Lucidpress, a digital publication software, have over five million users. In this blog post we explore five simple ways you can use visual communication in Confluence to support improved collaboration.
Confluence is a great tool for consolidating information, but managing it can become a chore if you’re not careful – especially if you bring in lots of content from other programs manually. Such content can quickly become outdated, necessitating repeated edits and uploads to keep the pages current.
To trim this kind of busywork, try these five strategies for more effective visual communication in Confluence.
1. Replace walls of text with visuals
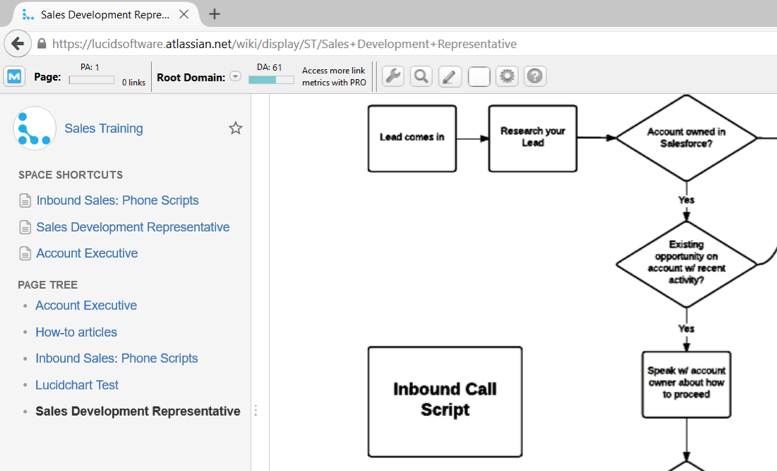
Walls of text aren’t just boring—they’re also ineffective and confusing, especially when it comes to describing conditional processes or complex issues. A good diagram, on the other hand, can clarify difficult concepts and hold readers’ attention. For instance, effective visual communication in Confluence could include members of a sales team embedding diagrams to guide new representatives through complex scenarios.
2. Find an integrated diagramming tool
Most diagramming plugins for Confluence function as standalone tools, which means you can only use them to create diagrams specifically for Confluence. Lucidchart, however, offers true integration in that it syncs all your Confluence diagrams with those you create in the web app. Those same diagrams are also accessible in the iOS app and in numerous other integrations, including JIRA and Google Apps. The result is that you can share, edit, and create diagrams however and whenever you need.

3. Collaborate visually
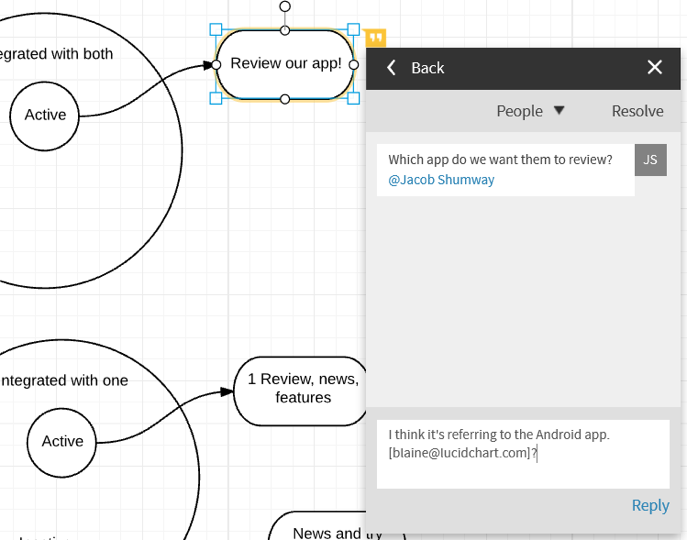
Believe it or not, your colleagues can each offer unique, valuable insights—but only if they’re given the chance. With Lucidchart, any number of users can work together on a single document in real-time. For those times when schedules don’t allow such collaboration, team members can also leave comments with @name mentions to request a colleague’s input through an email notification. The result is crystal-clear communication and high-quality visuals that save time now and down the road.
4. Import diagrams from Visio and OmniGraffle
While both Visio and OmniGraffle can produce powerful visuals, using these tools to create visuals for Confluence is simply inefficient. To do so, you’d have to export the file as an image, then manually upload it. If you ever wanted to edit the diagram, you’d have to repeat the process.
A plugin like Lucidchart gets rid of this problem. With Lucidchart, you can import Visio or Omnigraffle files directly, embed them in Confluence, and easily edit them if further changes are needed. Anyone with permission can open them from Confluence to make changes.
5. Visualise innovative solutions
Whatever your industry or role, a well-placed diagram not only helps you to communicate more powerfully but also gives perspective and insight that can help you find unexpected solutions. As you create diagrams or flowcharts, be sure to explore any opportunities to improve or streamline the process.
Interested in helping your team benefit from improved visual communication in Confluence? Sign up for a free trial of Lucidchart for Confluence.

