
This guest blog was written by Janis Gulbis, Marketing Manager at eazyBI.
Atlassian provides a set of tools for almost every step of the application lifecycle management – from requirements and planning to project operations, bug tracking, issue tracking, and project management. A hidden benefit of using Jira and these other project and information management systems is the accumulation of historical data.
For every stage in Application Lifetime Management, you can use the following Atlassian products:
- Confluence to define, describe, and document your projects
- Jira Software to plan, track, and manage
- Bitbucket as your version control system
- Test Management apps for test requirement, coverage, and execution management within Jira
- Jira Service Desk for operations
The historical data found in the tools above is natural by-product, containing valuable business information on project performance, bottlenecks, outliers, trends, anomalies, etc. You could use this information to:
- improve planning, execution, and forecasting;
- reduce estimation errors or ineffective resource allocation;
- prevent major mistakes from happening and/or repeating;
- identify trends, threats, and opportunities;
- keep teams informed, productive, accountable, and responsible;
- optimize and improve workflows, processes, and procedures;
- make well-informed, smart, data-supported decisions, among other things.
Unfortunately, this information is not always readily available.
Native Jira Reporting
Jira and most 3rd party apps come with some built-in reporting capabilities. These reports provide users with general overview, trends, as well as some performance reports.
In Jira you can create about 8-10 different charts, each with a few configuration options.
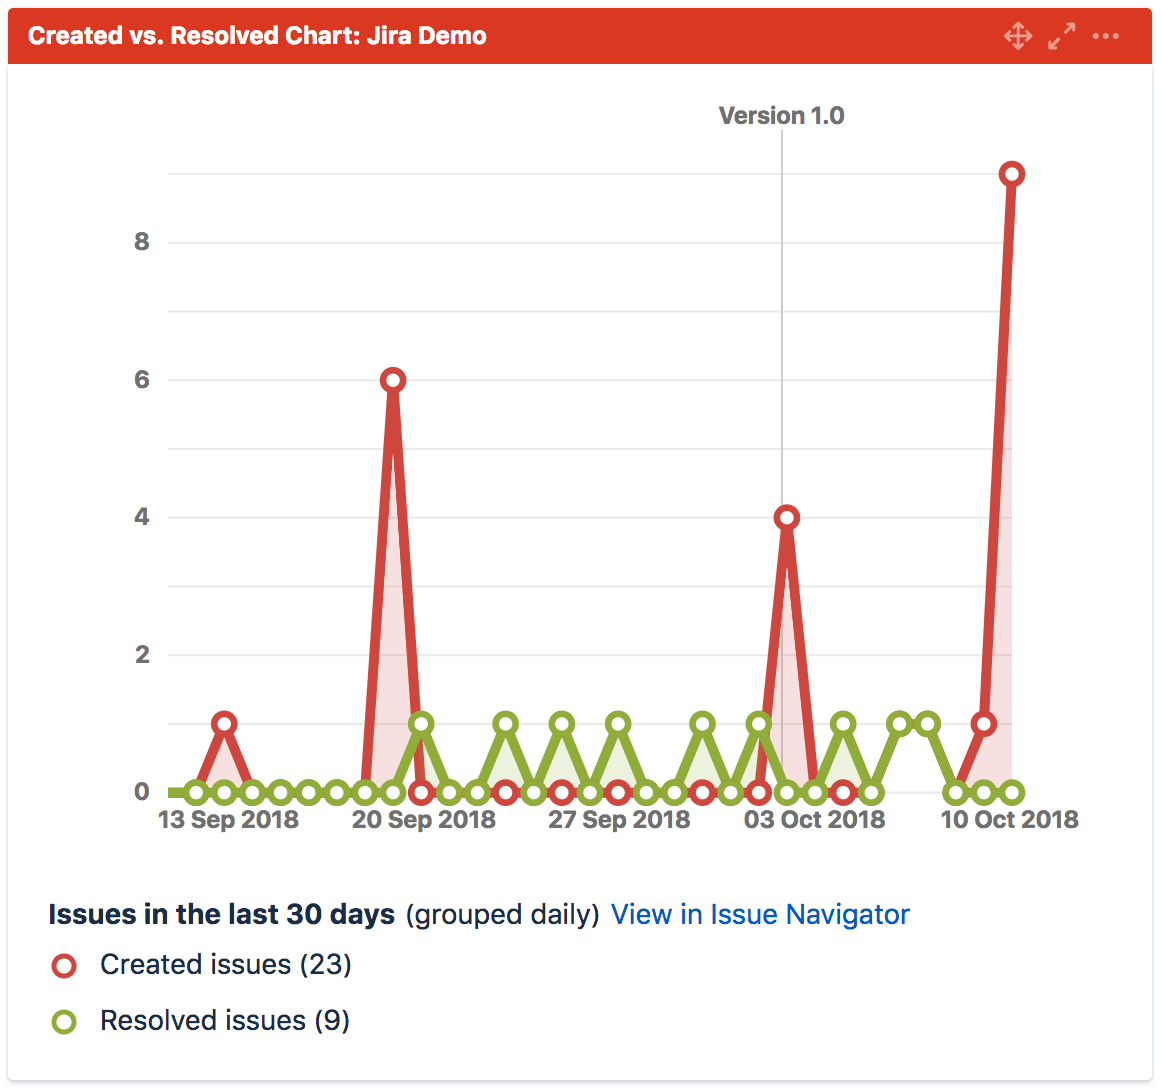
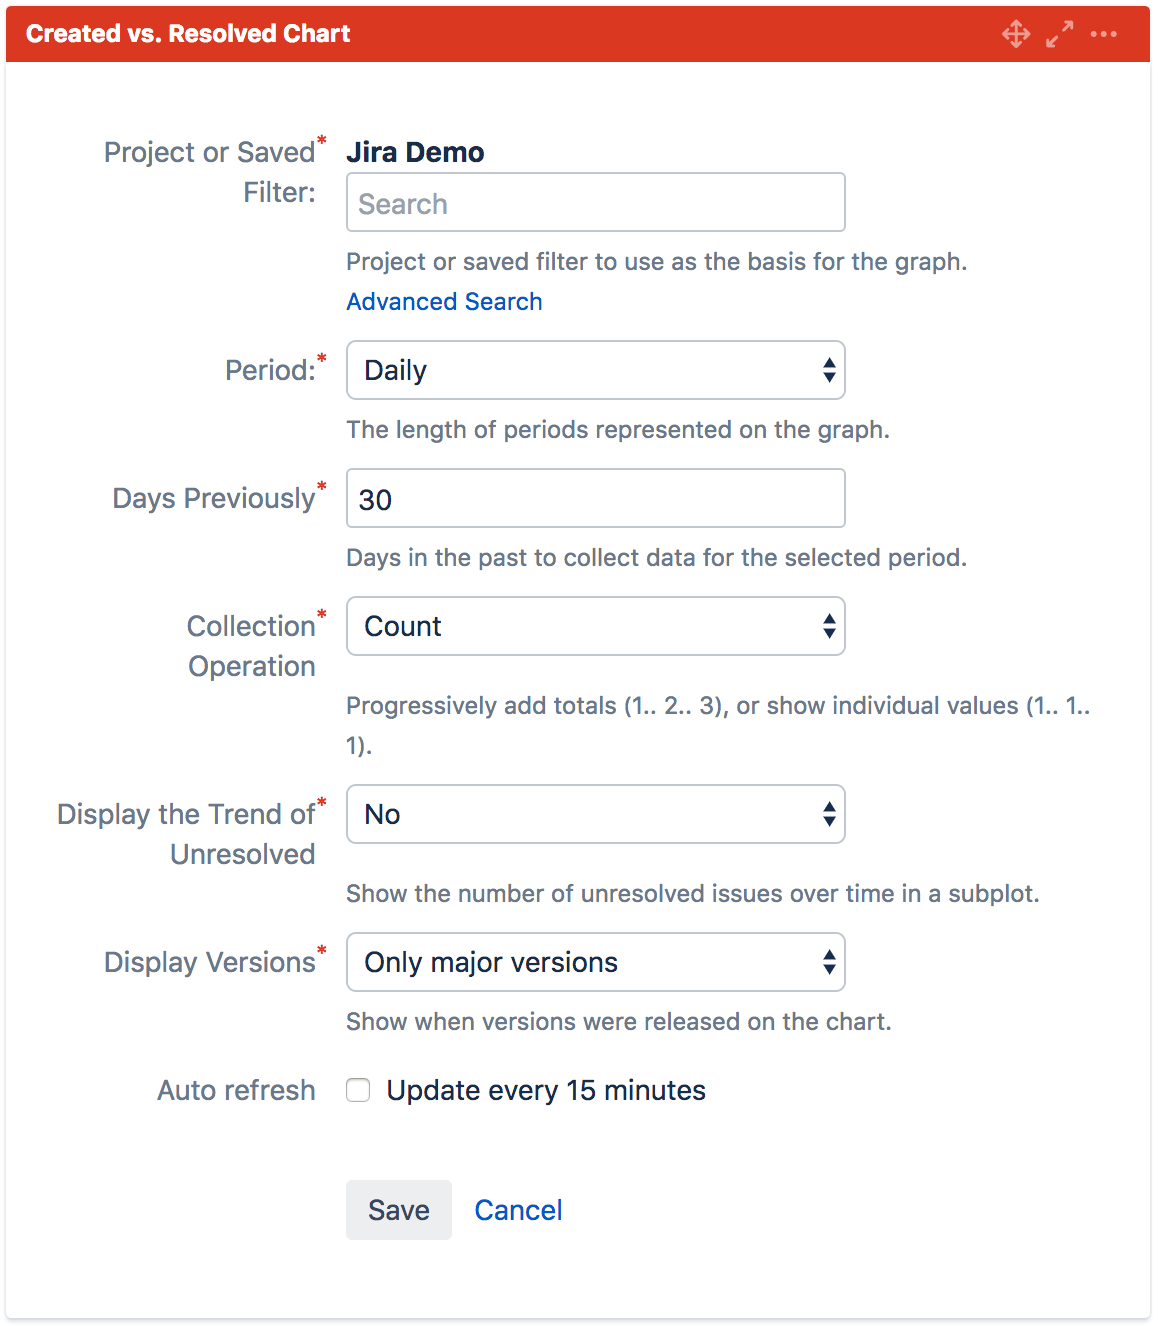
The Created vs. Resolved Chart allows you to see created and resolved issues over time. Configuration options are limited – you have the option to set the time-period and display issues individually or cumulative.

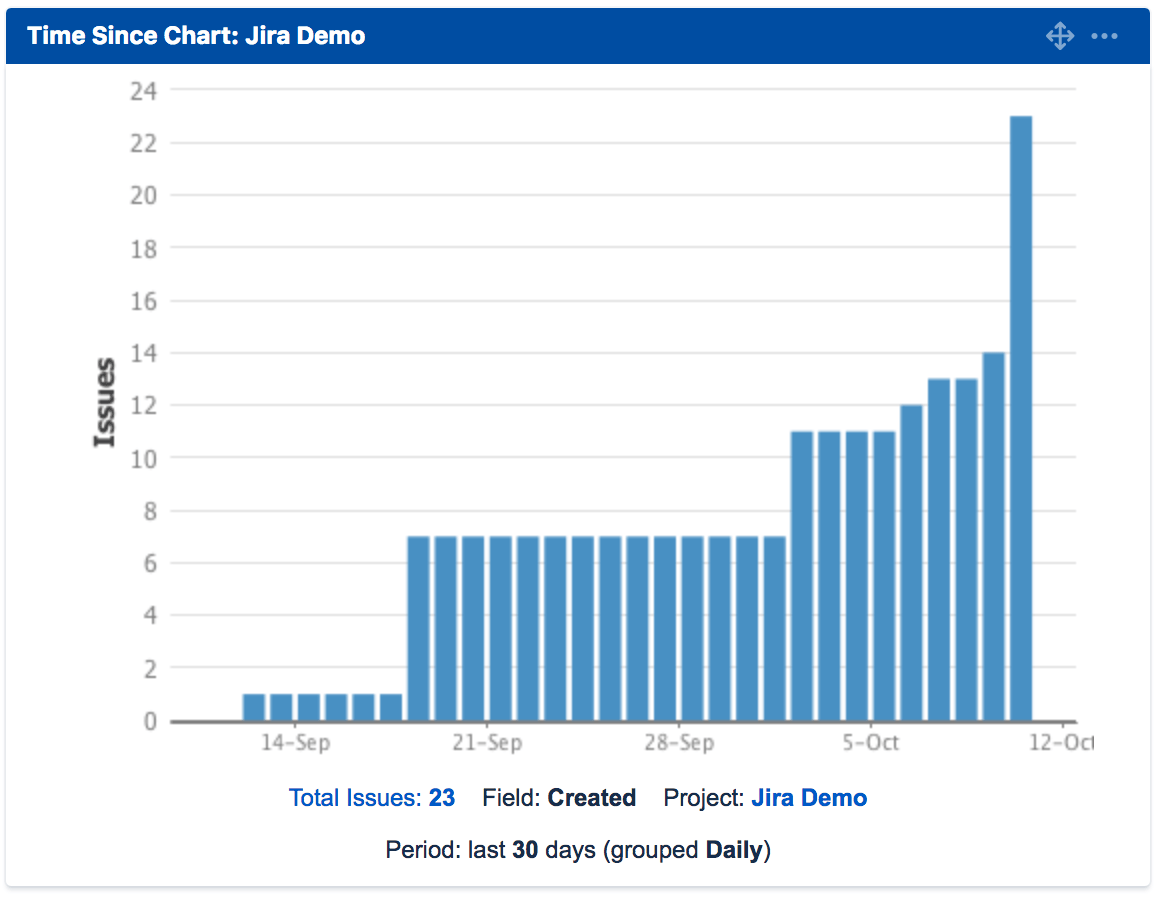
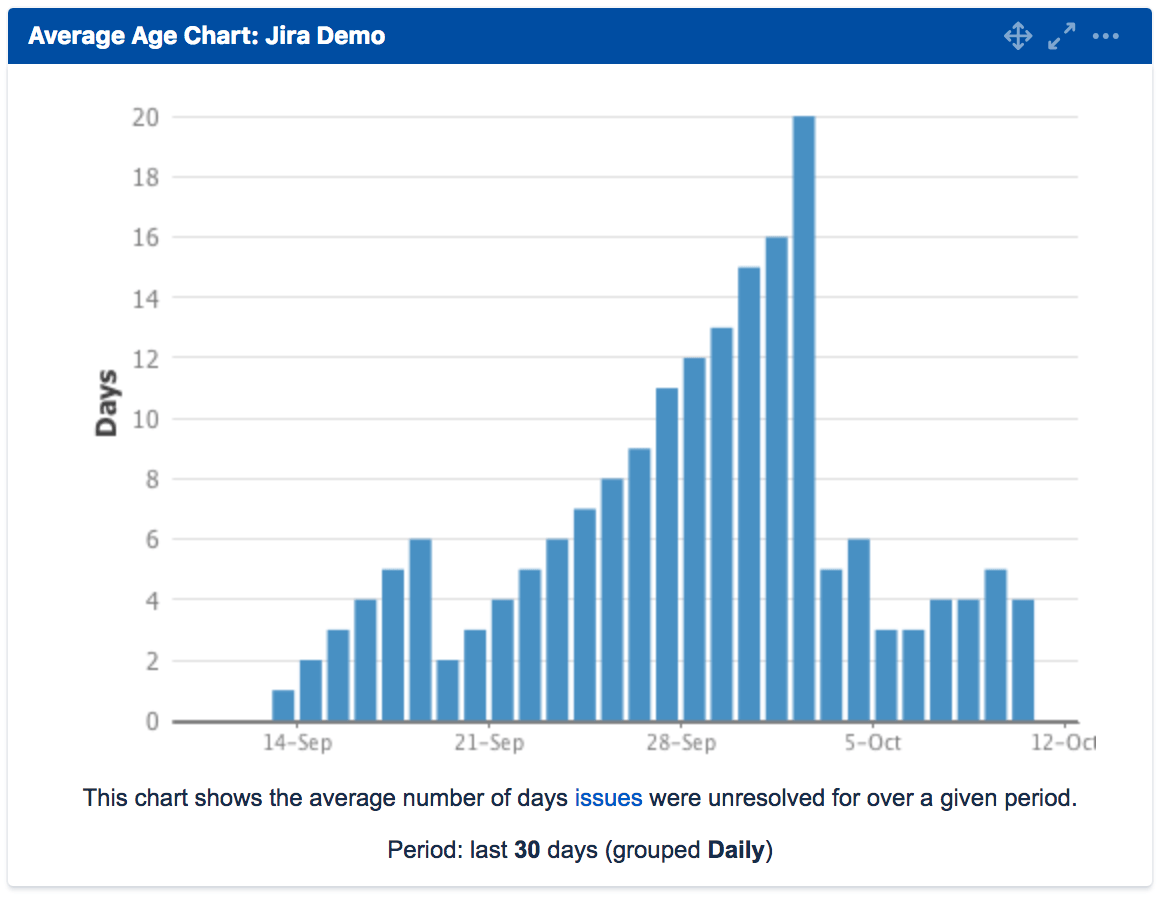
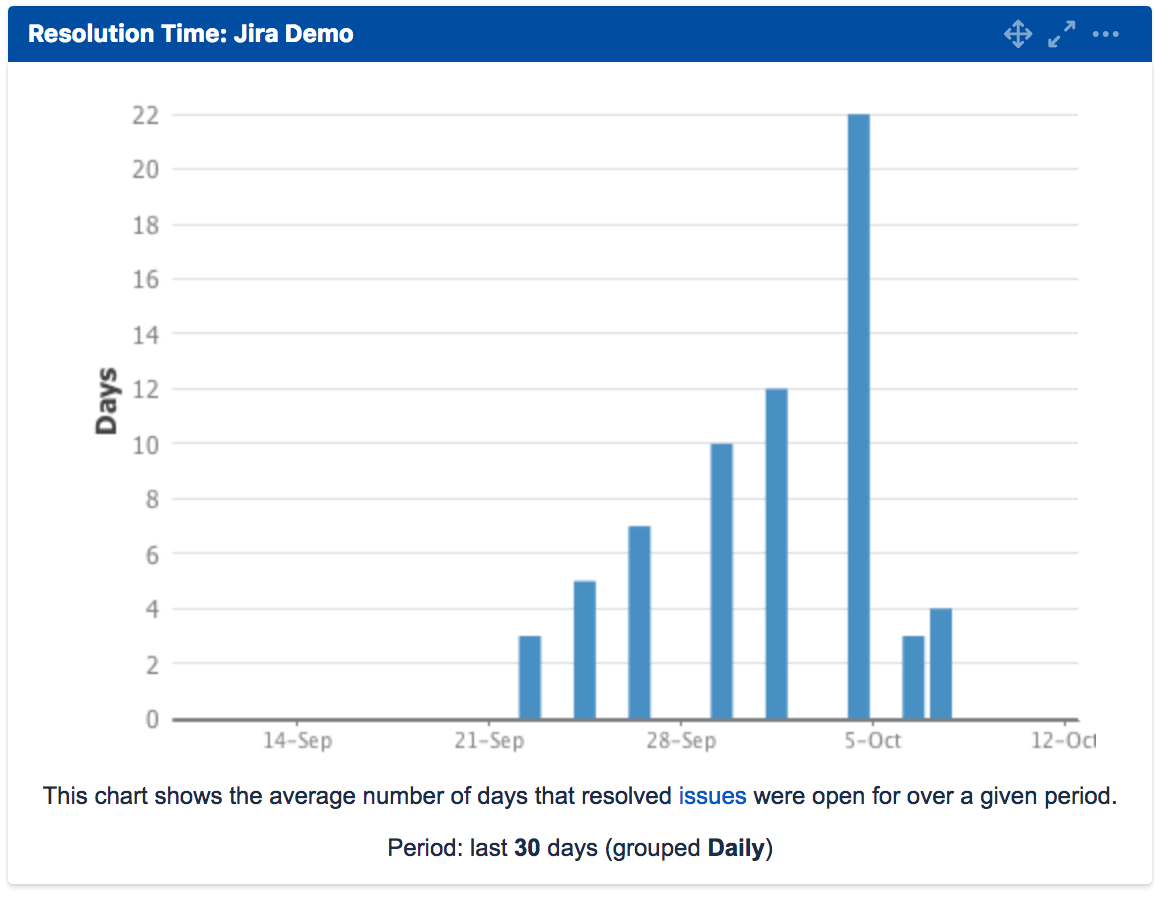
Issue creation, resolution, and average age time reports
Then there are a few charts that can show you how long ago issues were created, how long does it take to resolve an issue, as well as the average age of all issues in the project. These reports also offer very limited configuration options.
Other charts
And then there are a few more simple reports like a Recently Created Issues, a Pie chart, or a Sprint Burndown chart.
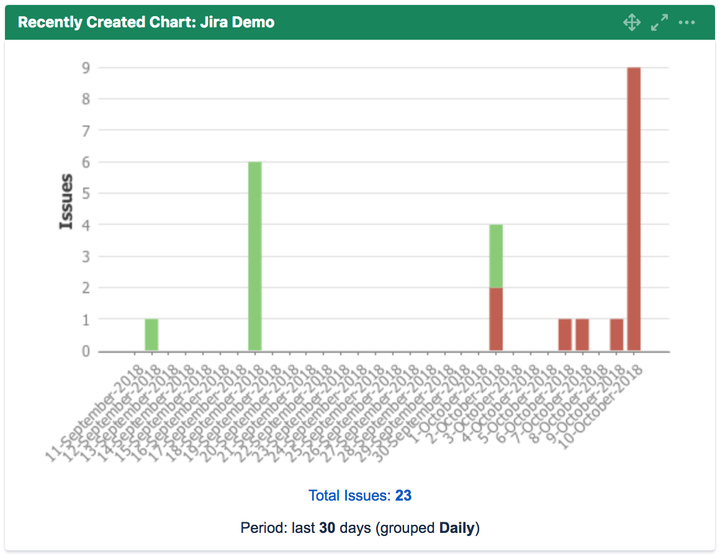
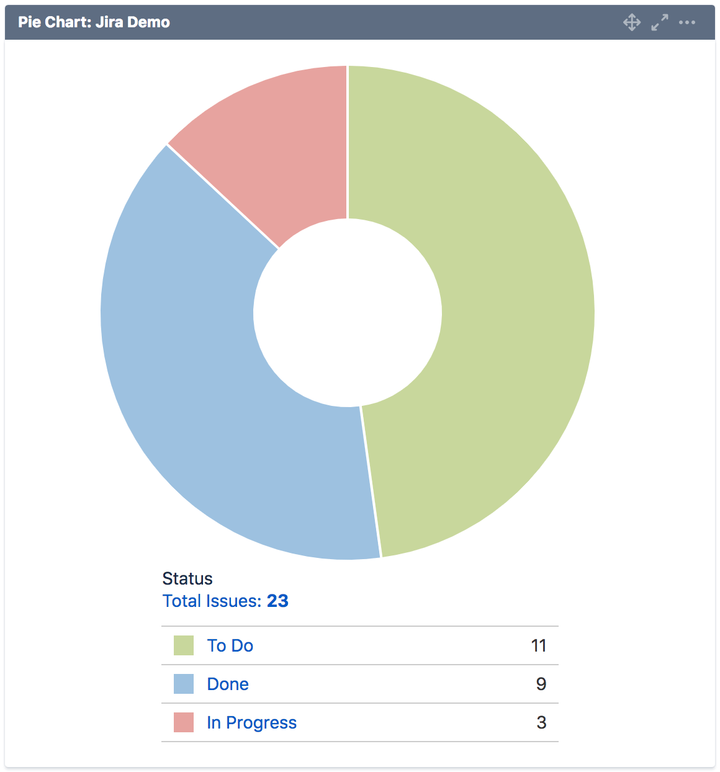
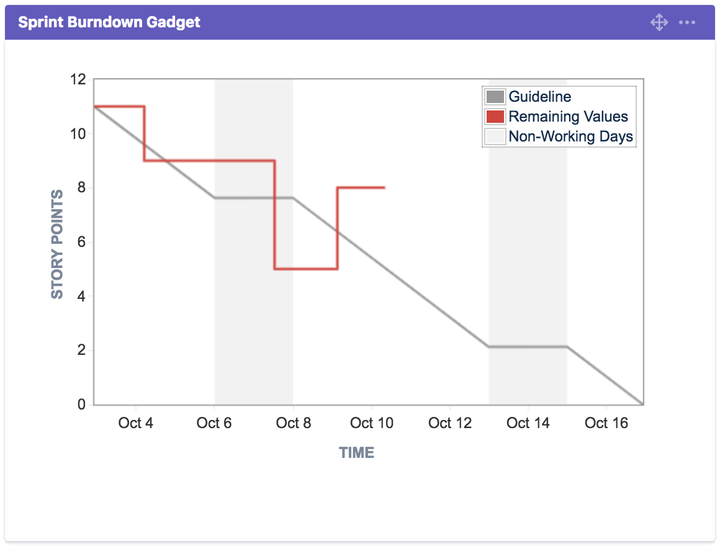
All these charts provide a very basic configuration. Generally you can display one project or filter, over a time period, grouped by a time interval (day, week, month, quarter, or a year).
These reports might be sufficient for most project members for a general daily overview and trends within one project.
Unfortunately, the built-in functionality quickly shows its limits as an effective project and business management. What if you want to know more about:
- Average age of issues by Type, Priority, or both.
- How long issues stay in each transition status.
- Created vs. resolved issues by Assignee, Type, Priority.
- History of unresolved issue statuses.
- Burndown or Burnup charts by Project or Assignee.
To access this information you’ll have to go beyond built-in Jira reporting capabilities.
Alternative Reporting Solutions
When it comes to more advanced custom reports, you have only 3 primary choices:
- Export your data as CSV or XLSX file and analyze your data in spreadsheets.
- Use the Jira REST API to import Jira data into an external reporting tool.
- Use an integrated 3rd party Jira reporting tool available on Atlassian Marketplace.
- Visualization in a spreadsheet
We are all familiar with spreadsheets, so this first option might seem like a great choice. Spreadsheets are great for quick and simple data visualizations but they won’t work well if you have a lot of data, need to update data frequently, or share your data effectively.
- Spreadsheet size is limited and large spreadsheet files are slow.
- Sharing requires sending a file – any modifications to one copy are not updated elewhere.
- There might be several concurrent version of the same file but different data.
- Data consolidation, filtering, and normalisation takes a lot of time.
- Spreadsheets are prone to mistakes and data manipulation.
- Creating reports repeatedly for the same or similar data takes time.
- Report visualizations are often inconsistent, leading to confusion and misunderstanding.
- Data ages – you need to start over when you need fresh data for your reports and decisions.
- Using an External Tool For Data Analysis
Jira provides users with REST API interface which allows exporting data from Jira into an external data analysis and visualization tool.
This option is somewhat similar to exporting your data to files, but with a few major benefits:
- Data update can be automated.
- Data consolidation, filtering, and normalization can be automated.
- Created reports don’t have to be created again.
- Visualizations are more consistent.
- Less mistakes and data manipulation.
There are a few limiting challenges with the REST API solution:
- The desired measures and dimensions must be manually modeled. Jira has a complex data structure – creating and updating data import schemes can be difficult and time consuming.
- Updates require a full reimport which can take hours or days – data re-imports put a lot of load on Jira database and Jira performance.
- Not all custom fields are available via REST API.
- Many standalone data visualization tools require a desktop app and might not be available in the cloud and accessible via browser.
- Many external data visualization tools use standard relation database schemes which are not meant for real-time data exploration. Report loading can be slow.
- It’s not possible to include reports as gadgets in Jira Dashboards or Confluence pages.
- Integrated Jira Reporting Apps
Jira reporting apps available on Atlassian Marketplace are integrated in Jira and support Jira data natively. Many common report examples and templates are available out-of-box. There are several popular apps on the Marketplace, each with its strengths and challenges.
Let’s review the most popular ones:
- Arsenale Dataplane
- All-In-One Reports for Jira
- eazyBI for Jira
Arsenale Dataplane
Arsenale Dataplane comes with an impressive set of configurable reports out-of-box, providing users with many additional reporting options. The tool is easy-to-use, more flexible than Jira’s built-in reports, and cover a much broader set of options. Reports are always up-to-date and any changes in Jira are instantly reflected in reports.
Main drawbacks:
- Reports and configuration options are predefined and limited.
- Arsenale Dataplane does not provide custom calculations.
- The tool connects directly to Jira database. Jira database is built for storage, but not optimized for rapid data retrieval and data aggregations. Reports might be slower. Loading bigger reports might decrease Jira performance.
- Interactive chart functions are limited.
- External data import from files, SQL, or other data sources are not possible.
All-In-One Reports for Jira
All-In-One Reports for Jira compared to Arsenale Dataplane is a more flexible tool. It’s built for building custom reports based on Jira measures and dimension, but it too has its limitations.
Main drawbacks:
- More complex user interface. Report building requires understanding of Pivot Tables, measures, and dimensions.
- Nested dimension reports available only in Matrix charts. All other reports support single dimension per row/column.
- Unable to switch between data visualizations when a report is created. To use a different dimension users have to create a new report.
- No custom calculations possible.
- No external data import possible.
eazyBI for Jira
eazyBI for Jira was built as a general purpose data visualization and analysis tool. Because of that it is extremely flexible and customizable. You can create a set of cross-project reports and dashboards with actionable KPIs and project status reports showing exactly who is working on what, when, where, and why?
eazyBI supports standard and custom Jira fields as well as data from 3rd party test management, time management, and asset management apps. It is possible to add and merge data from external data sources like SQL databases, REST API, CSV, Excel spreadsheets, and other data sources. With eazyBI users can create unlimited reports and custom calculations using built-in editor.
Main drawbacks:
- eazyBI stores all Jira data in a separate database. The reason behind it is to create a speed-optimized database structure for quick data retrieval and real-time data explorations.
- Although the basic import is straight-forward, advanced data import configuration might be overwhelming.
- The report-building interface is relatively simple, but requires understanding of Pivot Tables, measures, and dimensions.
- Custom calculations require knowledge of MDX (MultiDimensionaleXpressions)
- Loading reports based on large datasets and containing custom calculations can execute slowly and impact Jira performance if eazyBI runs within the Jira process. To reduce the impact on Jira eazyBI can be run as a separate child process.
Reports Are Worth a Thousand Words
The human brain processes images much faster than text, enabling the entire body to react to the stimuli. Why not use this power to convey meaningful and useful information about your team performance, project, or business?
Here are a few useful report examples you can create with eazyBI.
Created vs Resolved Issues Report
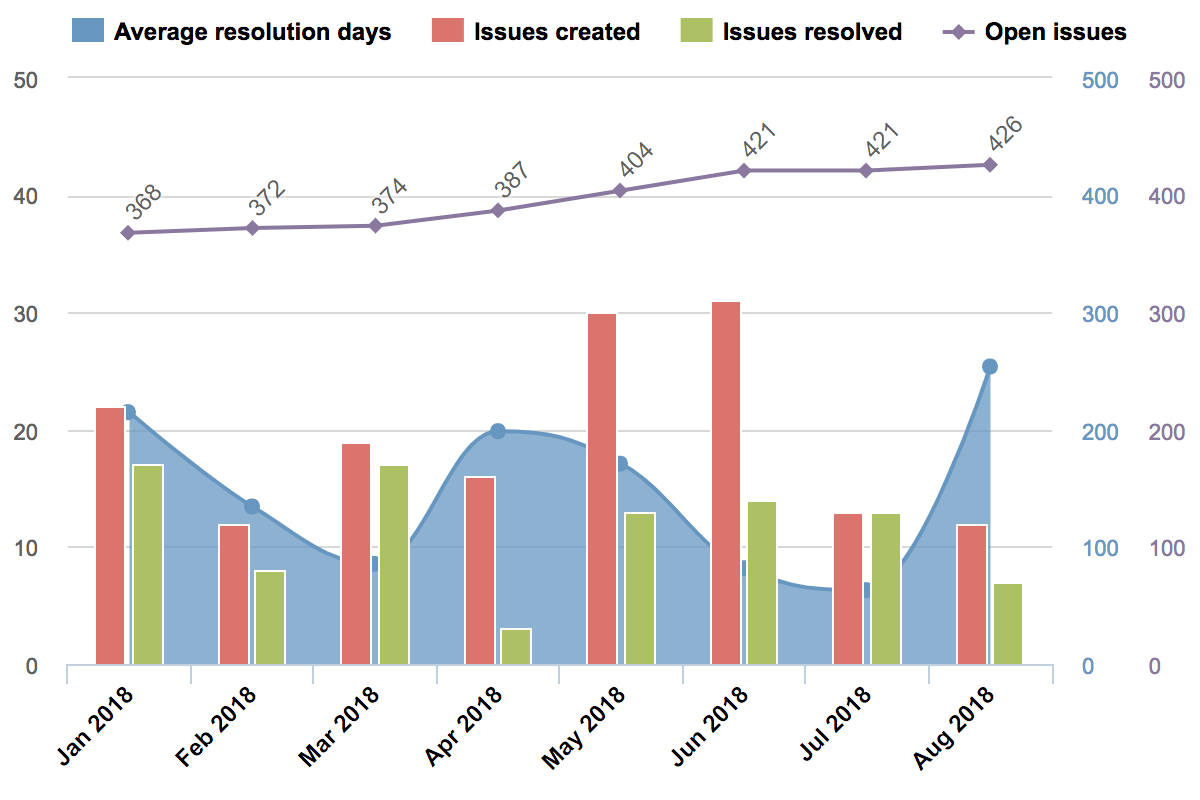
This is one of the basic overview reports that shows how many new issues were created and how many were resolved in a given period of time (day, week, month, quarter, or year). The report also shows the total number of open issues and how long (on average) it takes to resolve each issue.
You can get similar data with built-in Jira reports but not in one chart. You’d need 2-3 charts to see this information and the data would be limited to one project.
In eazyBI you can view this information based on all of Jira’s data, or filter down to a certain project, issue type, priority, assignee, or any other available dimension or combination.
https://eazybi.com/accounts/1000/cubes/Issues/reports/42786-created-vs-resolved-issues
Story Points Balance by Sprints

This is a very useful Agile report. The “Story Point Balance” report highlights the planning accuracy and a team performance for every sprint. It requires custom calculations and complex visualization, but it is available as a report template for eazyBI users.
Each iteration shows two columns side-by-side, both opening and closing story point statuses. It’s like an input/output balance sheet for each sprint.
- The left iteration column shows committed, changed, or added story points in a stacked column. Those are all story points that have been added to the sprint.
- The right column shows the number of completed, uncompleted, and removed story points to visualize how much was done from each sprint commitment.
- The running velocity line for last 5 sprints gives you a trend of your average completion rate, to adjust your planning for future sprints.
https://eazybi.com/accounts/1000/cubes/Issues/reports/168153-story-points-balance-by-sprints
Improvement Progress Report
![]()
The Improvement Progress Report allows Jira user to create hierarchies and then use the data in reports. For example, you can show total estimated hours and actual hours spent on a timeline with sprint dates. In addition this report will also show the ideal burn-up line and the actual program prediction line.
These progress reports can be built based on different data – time tracking, story points, etc.
https://eazybi.com/accounts/1000/cubes/Issues/reports/67366-version-report
History of Unresolved Issue Statuses
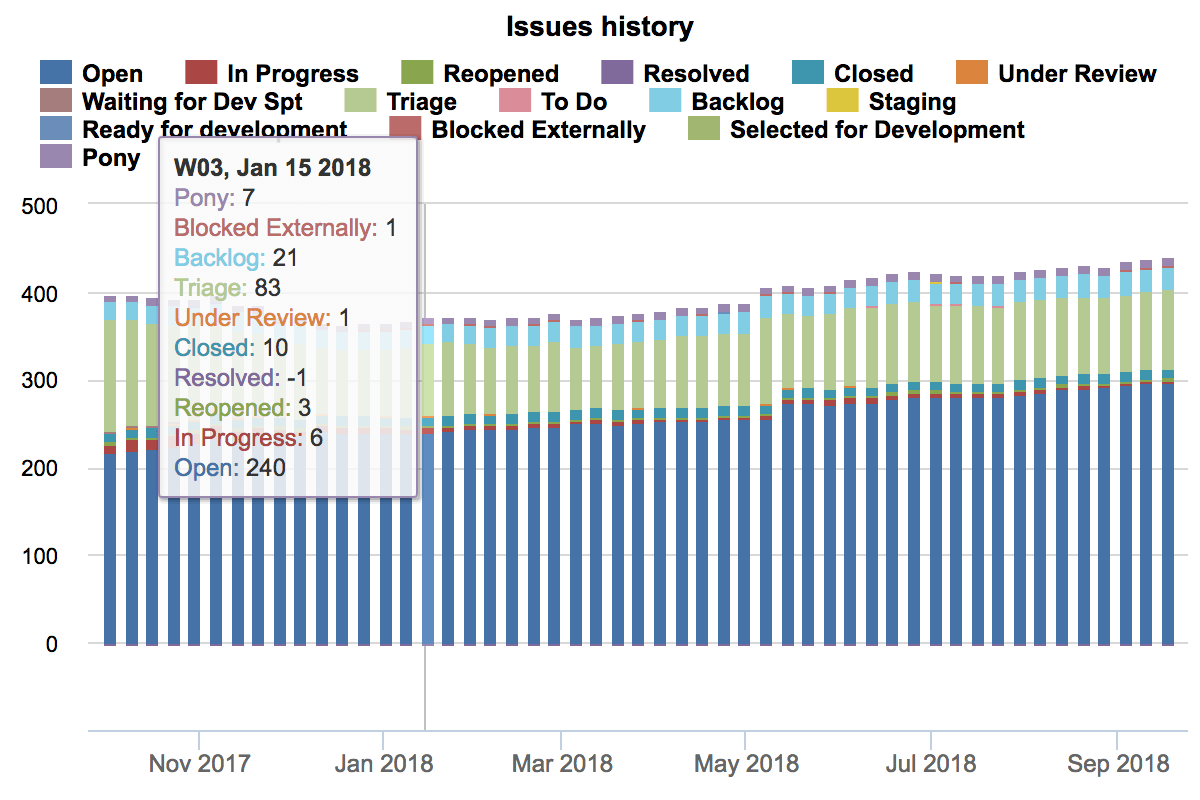
The unresolved issue report by status gives two insights into your project:
- The unresolved issue trend – are you generating more issues than resolving?
- The distribution of all unresolved issues across different transition statuses.
As you can see, the majority of the issues in each period are new (“Open”), following by issues in a “Triage” state.
Based on this information you can zero-in on certain statuses where the issues seem to stick longer, to see if the workflow can be improved.
It’s important to mention that these reports are interactive – you can drill into details or across different dimensions to explore your data and quickly identify background information for any data point.
https://eazybi.com/accounts/1000/cubes/Issues/reports/50046-history-of-unresolved-issue-statuses
Executed Tests vs. Found Defects

This test execution performance report give a clear overview of your testing activities, including tests created, executed, or tests returning a defect.
Use this information to validate your test results and quickly identify faults in your software.
Insight Asset Overview
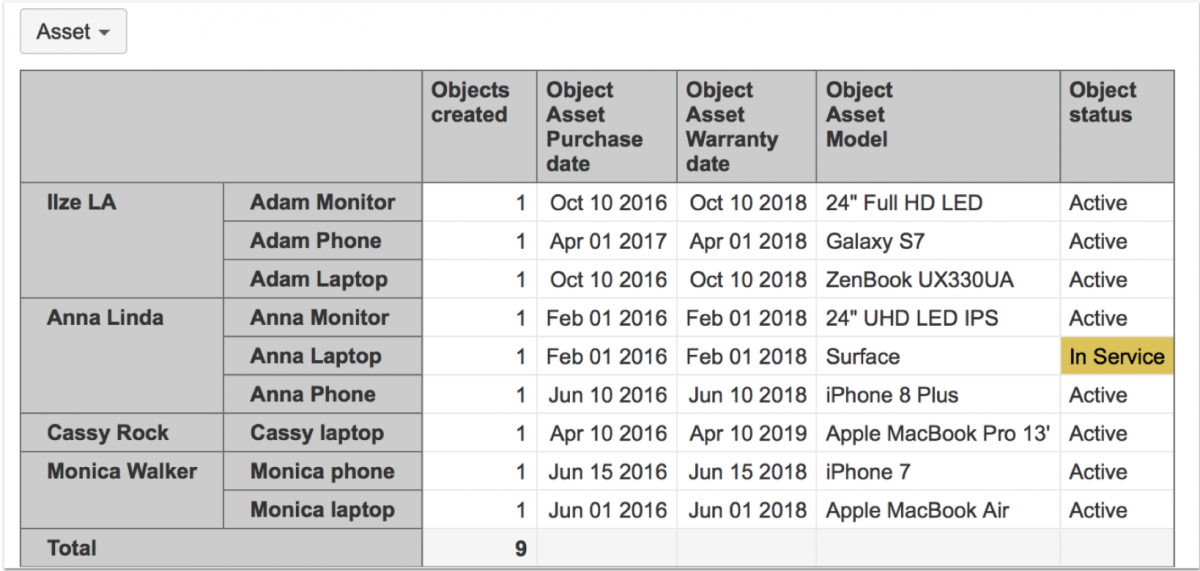
Insight is a powerful asset management tool available on Atlassian Marketplace. With Insight you can manage anything from computer hardware, to software, to employees, to anything else.
eazyIB supports Insight data analysis and visualization. For example, you could create a report on your Insight objects and assets that shows an object (a phone, a computer, a monitor), the owner, when it was purchased, when the warranty expires, and the current status of the asset.
Or you could analyze asset costs by owner, department, or asset type – you decide.
All these reports only scratch the surface or the possibilities provided by eazyBI. There are many more where these came from. You can see more examples of Jira Software Reports and Jira Service Desk reports in eazyBI demo accounts.
Try eazyBI